Mobility and Economic Hardship Index
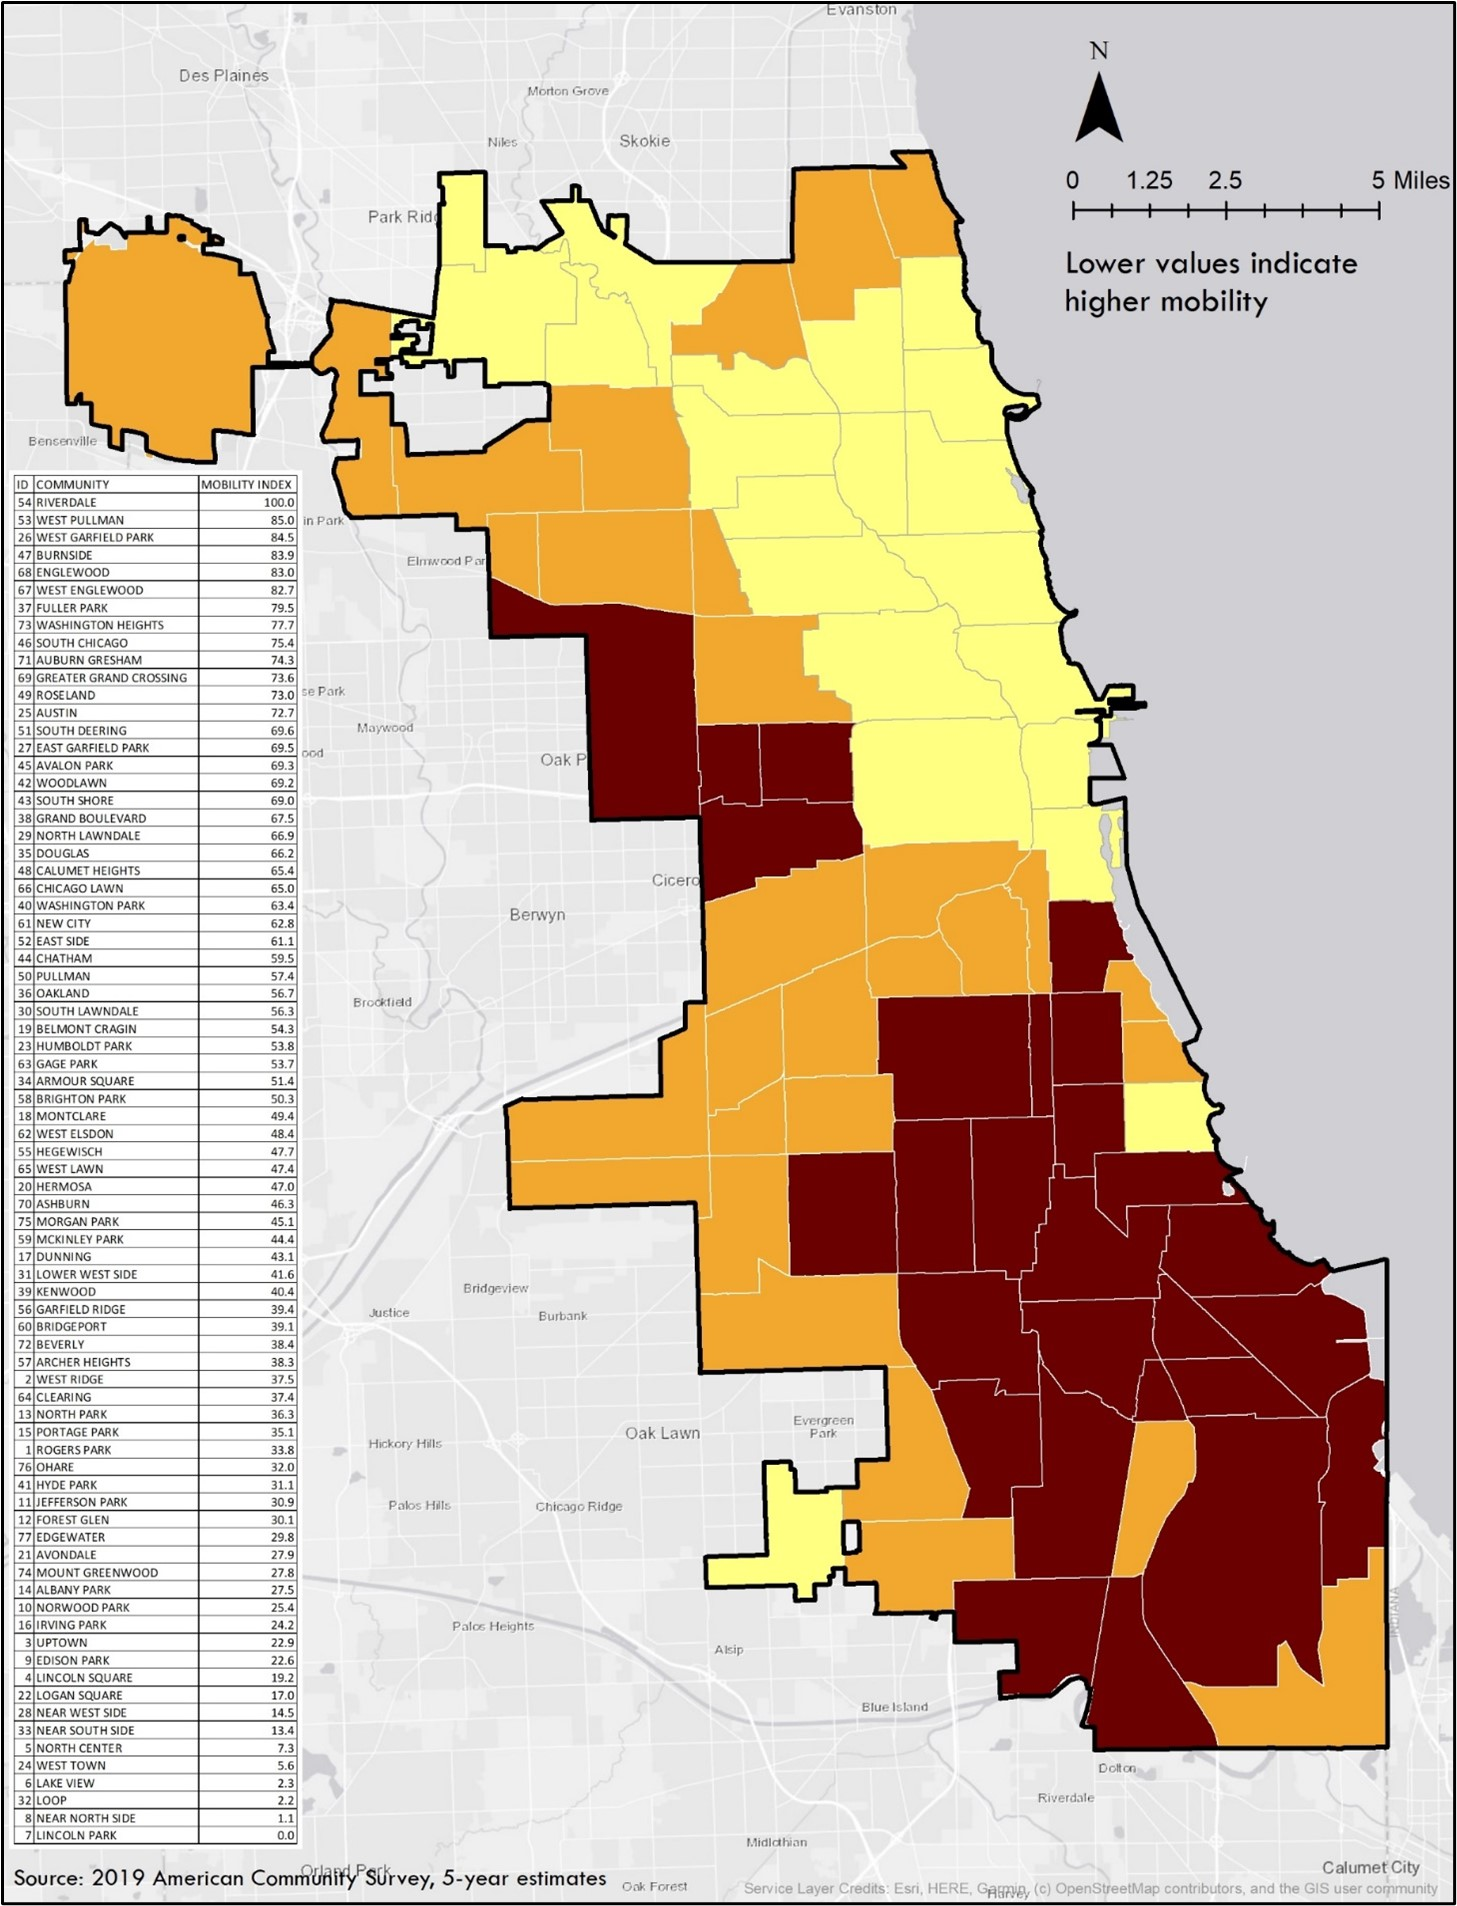
Central to CDOT’s implementation of its Strategic Plan is the development and implementation of the Mobility and Economic Hardship Index (MOBEC), which analyzes where Chicago residents experience the highest levels of economic and mobility hardship. MOBEC scoring is now a primary criterion in data-driven decision making at CDOT, guiding where and when infrastructure investments are made throughout the City. CDOT worked with the Center for Neighborhood Technology (CNT) to create the index in order to identify community areas where these combined economic and mobility hardships are highest.
CNT used the Economic Hardship Index created by the Chicago Department of Public Health (CDPH) in its Healthy Chicago 2.0 plan (2015) as a starting point to create MOBEC. Using data from the American Community Survey (ACS), an ongoing survey conducted by the United States Census Bureau that produces annual demographic data, the economic hardship index includes the following indicators:
- Percent of occupied housing units with more than 1 person per room (a measurement of overcrowding)
- Percent of households living below the federal poverty level
- Percent of persons in the labor force over 16 years old that are unemployed
- Percent of persons over 25 years old without a high school diploma
- Percent of population under 18 or over 64 years old, and
- Per capita income
To better focus infrastructure investments in communities with mobility challenges, CNT added indicators that provide a measure of mobility hardship. Using data from the ACS, the Mobility Hardship Index includes the following indicators:
- Commute time
- Percent of population with a disability
- Transportation cost as a percent of income (from CNT’s Housing + Transportation Affordability Index)
The result of the combined data is MOBEC, which maps the combined mobility and economic hardship for all 77 of Chicago’s community areas. To simplify the data, the community areas are divided into three categories: low, medium, and high.

