Respiratory Illness Data
Weekly Surveillance Summary
Key Points, updated: 2/28/2025
- Overall acute respiratory illness activity level remains Moderate across Chicago. Flu activity decreased from High to Moderate and all influenza surveillance indicators continue to decline. COVID-19 activity remains Low. RSV activity also remains Low and continues to decline across all surveillance indicators.
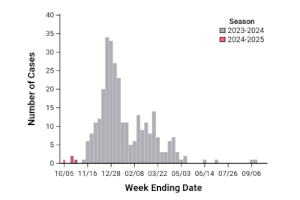
- ED visits and hospital admissions for flu remain elevated among all age groups but continue to decrease after peaking in late January; ICU admissions also continue to decrease. ED visits, hospitalizations, and ICU admissions for RSV continue to decrease and are past peak for the season. COVID-19 ED visits among children less than 5 years of age have increased for the past two weeks but overall ICU admissions have decreased slightly since last week.
- The percentage of specimens that tested positive for flu remains elevated (15.0%) but has decreased from a peak of 23% in January. Almost all (93%) typed flu specimens for the week are flu A; among those subtyped 72% have been H1N1 and 28% H3N2. The percentage of specimens testing positive for flu B remains low but has increased for the past five weeks. Test positivity for RSV has been decreasing since mid-December and continues to decrease. Test positivity for COVID-19 did not change from the previous week and remains low.
- Wastewater concentrations for flu A, RSV and COVID-19 remain moderate compared to baseline concentrations. Influenza B concentration levels are increasing.
- The CDC has issued interim estimates of 2024-25 Seasonal Influenza Vaccine Effectiveness (VE) and 2024-25 COVID-19 VE, which suggest that this season’s influenza and COVID-19 vaccines were effective in preventing medically-attended illness, including hospitalization, in the US. It’s not too late to get vaccinated!
- Flu and COVID-19 vaccine coverage across the city remain low. See CDPH’s Mid-Season Seasonal Respiratory Vaccine Coverage Report for more details.
- For information on the national bird flu outbreak, see the CDPH H5N1 Bird Flu webpage and the CDPH HAN: Flu Page for clinicians.
Respiratory Illness Dashboard
The Respiratory Illness Dashboard below summarizes information about respiratory virus disease activity in Chicago, with a focus on COVID-19 (caused by the SARS-CoV-2 virus), influenza, and respiratory syncytial virus (RSV). The dashboard will be updated every Friday at 1 p.m.
Additional Respiratory Illness Data
Seasonal and Historical Summary Reports
Find CDPH’s weekly surveillance report that tracks influenza, COVID-19, RSV, and other viral respiratory disease activity in Chicago.
Wastewater Monitoring
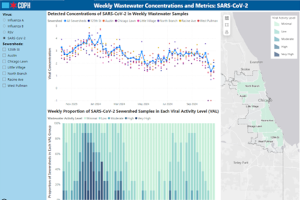
Find information about how respiratory viruses are monitored in Chicago’s wastewater.
Variants and Genomic Surveillance
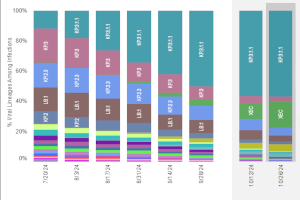
Learn more about how CDPH and the CDC are using genomic testing to monitor changes in diseases in Chicago.
Chicago Data Portal

Browse surveillance datasets that are available for download on the Chicago Data Portal.
Chicago Health Atlas
Access health data for Chicago and your community.
Archived COVID-19 Data Dashboard
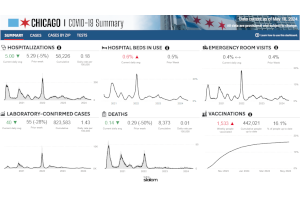
The archived COVID-19 Data Dashboard is available for historical reference.
Archived Data Reports
Archived data reports
National and State Respiratory Illness Data