All Safe Data
All Safe Data
The Safety Gap
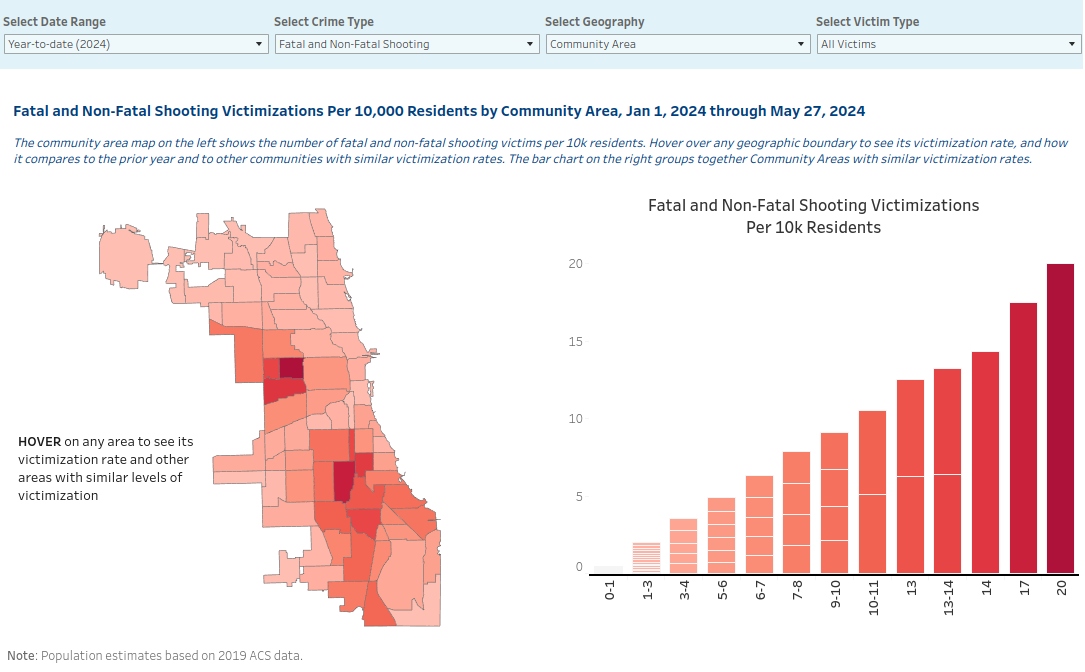
The “safety gap" is the difference in rate of shootings and homicides in community areas with the highest and lowest levels. It is one of the primary outcome indicators measuring the disparities between the neighborhoods that experience relatively little violence and those that continue to bear the greatest burden.
From 2018 through 2020, 63% of the city’s homicides and non-fatal shootings occurred within 15 community areas that comprise 24% of the city’s population. These communities are overwhelmingly African American and Latinx, and violence has persisted here for decades because the underlying causes—systemic racism, disinvestment, poverty, lack of social services—have gone unaddressed, and the use of policing as the primary solution has failed.
Empowering Chicago: Access Real-Time Health & Safety Data
All Chicago residents, as well as government, business, philanthropy, and community leaders can use this data to both better understand health and safety in Chicago and identify opportunities to improve community safety.
Violence Reduction Dashboard
The Violence Reduction Dashboard provides real-time data on violence trends in Chicago, highlighting the inequitable impact across the city. This public tool supports community-based violence reduction partners by increasing government transparency.
Chicago Health Atlas
The Chicago Health Atlas allows residents to review, explore, and compare health-related data across communities over time. It also tracks progress on implementing Healthy Chicago, the citywide plan for health equity.


